Record a baseline before making changes
Local SEO needs a baseline because you cannot judge a change without knowing the starting pattern. A geo-grid after a website launch is not “proof” if nobody saved the grid from the month before.
The baseline is the first comparable scan plus the configuration that produced it. It is also a snapshot of the business: category, address, hours, target page. Without that, later movement has no context. The geographic method is explained in how to track Google Maps rankings.
Before making SEO changes, record the scan date, scan configuration, keyword, location, Google Business Profile category where relevant, the target page, and important business changes already in motion.
- Date and time zone of the scan.
- Centre, grid size, radius, tool, and whether Apple Maps or Google Maps was used.
- Exact query string.
- Listing name and whether the address is public or hidden.
- Primary category (and additional categories if you will edit them).
- Landing-page URL the profile or ads point to.
- Known events: move, rebrand, new service, review campaign, competitor opening, hours change.
This list is operational, not ceremonial. If two people cannot recreate the scan from the notes, the notes failed. Two people searching on their own phones is also not a baseline; that disagreement is diagnosed in why different people see different Maps rankings. A tracker that disagrees with a live Google search, or two tools that disagree with each other, is why local rank trackers and Google show different results.
How often should Maps rankings be checked?
Maps rankings should be checked often enough to see a trend for your use case, and not so often that normal volatility becomes a weekly panic. There is no universal daily requirement.
- A stable local shop with slow change may only need a monthly comparable scan on core queries.
- A reputation incident, suspension, relocation or category change may justify a tighter window until the listing settles.
- Agencies reporting monthly should scan on a fixed cadence that matches the report, not ad hoc the day before the meeting.
- Daily checks for every keyword are usually wasted spend unless you are diagnosing an active incident.
Match frequency to decision speed. If you cannot act on the data, checking it daily does not make the SEO faster.
Settings that must stay comparable
Scan settings should remain consistent because radius and grid size define the sample. Changing them changes averages and pack coverage even if Google’s results are unchanged. That artefact is often misread as ranking volatility or as SEO success.
Freeze pin, grid, keyword set, rank rule and device if you want one trend. Google does not publish a single official local rank. Source: Tips to improve your local ranking on Google. Do not invent a blended “score” from unlike exports.
Choosing grid size and radius to match customer geography, before you start a trend, is a different job from repairing a series after someone already changed them. Use grid size and radius for local rank tracking to pick those settings. Stay on this page when the question is whether two scans can still be compared.
Why monthly local ranking reports stop being comparable
Months become incomparable when the pin, grid, keyword list, rank rule or device changed between exports. The two tables are then not the same measurement, even if both slides say “average rank.”
Illustrative pattern — not client data. January used a 7×7 at 1 km. February used a 5×5 at 2 km after someone “tidied” the project. The slide still says “average rank improved.” The job is report settings, not a new ranking story.
Recipe
Pin, grid, keyword list, rank rule? Write the settings that produced the table.Last
What did last month’s export use? A moved pin or new keyword set breaks the series.Now
What does this month use? If they differ, you do not have one trend.Sibling
Tracker versus Google is different Use that guide if the same recipe still disagrees with Search.Next
Do not average unlike grids Freeze the recipe or label a new series.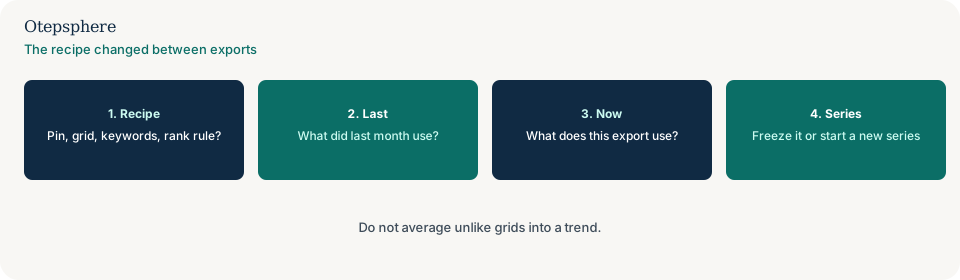
Stay here when last month and this month cannot be compared because the process drifted. If the same recipe still disagrees with what you see in Search or Maps on a phone, that is tracker versus a manual Google search. If two products run at the same time with different engines, that is when two rank-tracking tools disagree. Neither of those problems is fixed by averaging unlike monthly files.
What happens when grid size, radius or centre changes
Grid size is how many points. Radius is how far those points spread. They are different controls. Changing either one changes which searcher locations you sample. The second scan is then not the same measurement as the first, so the difference is not a clean ranking change.
Old
What were grid size, radius and centre? Store the recipe with the old scans.New
What did you change, and on which date? A wider radius samples different demand.Split
Stop treating it as one trend Outer cells and averages will move even if Maps did not.Yes
Start a new labelled series Keep the old scans as a closed chapter.Next
Choosing size and radius is a different job How to pick settings sits on the grid-size guide.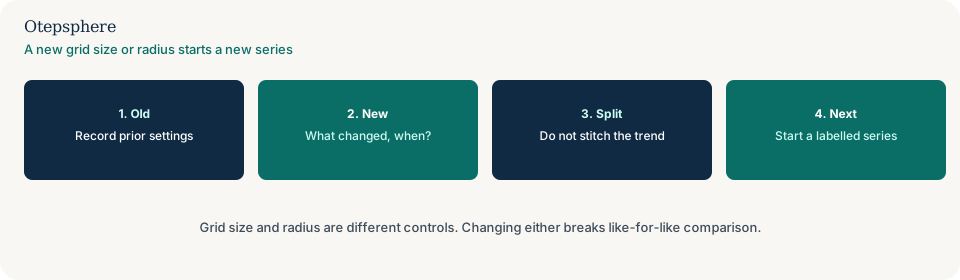
A wider radius adds cells farther from the pin, where distance already makes you less relevant. The mean falls even if the inner cells did not. A denser grid can add mid-block points that were never in the old average. Google’s local ranking help still includes distance. Source: Tips to improve your local ranking on Google.
A centre moved to a new suburb is a different market. Treat it as a new study. The old town’s trend does not continue on the new pin. Empty outer cells after a wider radius are often a sampling change, not a ranking emergency.
If you still need to choose a sensible size rather than repair a broken series, switch to grid size and radius. How to run the grid at all is how to track Google Maps rankings.
Changes to keywords, device or vendor rank rules
A keyword-list change measures a different set of searches. Adding “emergency plumber” to a report that used to track “plumber” is not the same series, even if both words feel local. Removing a weak query to “tidy” the average is also a recipe break.
Device and vendor rank rules belong in the same freeze. Desktop versus mobile, pack versus Maps finder versus organic, and how a product counts position 1 — including whether it skips ads, Maps placements, or listings without a website — all change the number you will write on the slide. If the monthly process drifted on any of those, you do not have one trend.
Two tools that never shared a pin or a rank rule are a vendor mismatch, not a monthly-process drift. Diagnose that on when two rank-tracking tools disagree.
Reset the baseline or compare a clearly labelled subset
Keep a settings register beside each export: listing identifier, exact query, language, result surface, coordinates, grid size, radius, device where relevant, vendor rank rule and scan timestamp. Compare that register before comparing the ranking averages.
If the radius widens, the new scan samples places the old scan did not. If the keyword list changes, the report measures a different set of searches. Close the old series with a note explaining the change and establish a new baseline. Do not join unlike averages into one continuous performance chart.
Where old and new scans contain exactly the same coordinates and query, you may compare that shared subset. Label its scope explicitly and keep it separate from either full-grid KPI. Retain the original exports so a future reviewer can reproduce the comparison.
Old and new settings register
| Register field | What to store with every export | If old and new differ |
|---|---|---|
| Listing identifier | Profile or listing ID, name, and whether the address is public | Close the old series |
| Exact query and language | Full string, not a paraphrase | New series — different searches |
| Result surface | Maps finder, Search local pack, or organic | Stop comparing the averages |
| Coordinates / centre | Latitude and longitude of the pin or grid centre | New series, or a labelled shared-coordinate subset |
| Grid size | Point count, for example 5×5 versus 7×7 | New series; do not stitch the mean |
| Radius | How far the points spread | New series — new places were sampled |
| Device | Desktop or mobile where the vendor records it | New series |
| Vendor rank rule | How position 1 is defined, and how absent results are counted | New series |
| Scan timestamp | Date, time and time zone | Note the gap; the later scan is not automatically the correction |
Reset-baseline decision table
| What you see | What it usually means | Decision | What not to assume |
|---|---|---|---|
| Radius doubled; average rank worse | New outer cells | Start a new series; inspect shared inner cells separately | That Maps visibility crashed overnight |
| Grid size increased; mean moved | Different sample | Do not stitch the chart | That more points are automatically more accurate |
| Centre moved to a new suburb | Different market | Treat it as a new study | That the old town’s trend continues |
| Keyword list, device or rank rule changed | The monthly process drifted | Freeze the recipe or start a labelled series | That you can average the two tables |
| Old and new scans share some exact coordinates | A comparable subset exists | Compare that subset only; keep it off the full-grid KPI | That the subset replaces either full scan |
| Settings unchanged; ranks still moved | Possible real change | Annotate events and read the trend on this page | That a settings break is still the explanation |
| Same recipe; tracker ≠ phone | Tracker versus Google | Use the tracker-versus-Google guide | That this month’s process drifted |
| Two vendors, two numbers | Tool disagreement | Use the two-tools section of the tracker guide | That one vendor is “the official rank” |
Annotate business changes without claiming causation
Annotate events that could plausibly affect relevance, distance, prominence or the measurement itself.
- Google Business Profile category changes.
- Location moves, address edits, or service-area list changes.
- Website launches, service-page updates, or landing-page URL changes.
- New service pages — without assuming they caused Maps movement.
- Review volume or rating shifts, including a sudden burst or a wipe-out.
- Competitor openings, closures, or aggressive listing changes.
- Opening-hour changes, including holiday hours left in place by mistake.
- Known algorithm turbulence or product changes in Search and Maps, labelled as possible context rather than a proven cause.
- Scan-tool or configuration changes.
Profile field monitoring is covered in GBP change monitoring.
Normal ranking volatility is small movement in Maps positions without a lasting geographic pattern: a cell flipping between 2 and 4, or a pack appearance that comes and goes at the edge of the grid. Local results are not frozen. Competitor reviews, user location estimates and interface tests can all shift a sample. Otepsphere does not publish a universal “±N positions is noise” rule. Markets differ. A personal-injury query in a city centre is not a village bakery. Judge volatility against your own baseline series, not against a blog percentage.
A change becomes a meaningful trend when it persists across several comparable scans, appears in a geographic pattern (not one noisy cell), and still stands after you have annotated business and competitor events. One improved screenshot is not a trend. Three monthly scans with the same settings, showing pack coverage expanding in the same suburbs, is a trend worth investigating. Even then, investigation is not the same as claiming your last GBP post caused it.
Before-and-after measurement compares two (or more) scans that share the same method, with the work done in between listed in plain language. Show the geographic pattern, not only a headline metric.
Illustrative example — not client data. An accountant records a May 5×5 grid for “tax accountant”. In June the firm publishes a genuine service page and corrects the GBP website URL. July’s scan uses the same grid. Pack coverage rose in the northern cells. That is a before-and-after observation. It is not proof the page caused the lift; a competitor also closed in June.
Correlation is not necessarily causation because Maps rankings move for many reasons at once. A ranking improvement after you added photos may be coincidence, seasonality, a competitor’s suspension, or a category fix you forgot you made. Honest reporting says: we changed X; visibility did Y; possible other factors are Z; we do not have an isolated experiment. That tone is more useful to an owner than a claimed “ranking factor win”. Google documents relevance, distance and prominence — not your specific tactic’s percentage contribution. See ranking factors.
Monthly reporting checklist
- Write the current recipe on the report cover and compare it with last month’s export settings.
- Rerun core queries on the same grid, radius and centre.
- Store date, configuration and listing identity with the file.
- If any setting moved, stop the trend line and start a labelled series.
- Compare only cells that still share coordinates, and label that subset.
- Annotate profile, website, review, competitor and hours events.
- Compare pack coverage and distribution, not only average rank.
- Ignore one-cell flips unless they repeat.
- Do not change scan settings to make the month look better.
- Separate Maps visibility from conversions in the write-up.
- Flag missing data as missing.
- If the same recipe disagrees with Google, or two tools disagree, switch to tracker versus Google results.
How should recurring tracking be automated?
Recurring tracking should be automated by locking the configuration and running it on a calendar that matches reporting, with enough credits or time to cover the keywords that actually matter.
Local Falcon documents Campaigns for scheduling scans across locations and keywords so ranking changes can be tracked over time. Use campaigns to prevent ad-hoc setting drift. Do not automate fifty near-duplicate queries if three commercial services explain the business. Source: How to schedule scans using Campaigns.
Local Falcon Campaigns can store that schedule. Affiliate link.
How can Trend Reports help?
Local Falcon Trend Reports can show how rankings change over time for a specific keyword and location, including historical ARP, ATRP and SoLV (or SAIV on AI scans). That helps you see direction on a stable configuration without opening every past scan by hand.
A trend line is still only as honest as the scans underneath it. Mixed radii, mixed grids or mixed listings will draw a smooth chart of incomparable samples. Confirm current report behaviour on Local Falcon Trend Reports.
Help is useful when several people can edit the tracking project and nobody wrote the recipe down, or when a year of scans used three different radii and nobody labelled them. It cannot produce an official Google rank, recover a like-for-like trend that was never stored, or promise that a new recipe will match last year’s mean.
Sources and further reading
- Local Falcon: How to schedule scans using Campaigns
- Local Falcon: Trend Report
- Google Business Profile Help: Tips to improve your local ranking on Google
- Google Search Central: How Search works
- Google Business Profile Help: Manage your service areas
Track Local Visibility Consistently
Scheduled geo-grid scans with locked settings make monthly comparisons possible. They still require a human to annotate what the business actually changed.
Try Local FalconAffiliate link. Otepsphere may earn a percentage of qualifying purchases at no additional cost to you. Read the affiliate disclosure.
Want monthly reporting that resists rank panic?
Otepsphere can set a comparable series and report trends with limitations instead of celebrating one green scan — or splicing unlike grids into a chart.
View Local SEO reportingPublished by Otepsphere
Published by Otepsphere, founded by Joseph Enmanuel. Learn about Otepsphere and its approach to local SEO.