What does a broken series mean?
It means the second scan is not the same measurement as the first, so the difference is not a clean ranking change.
Grid size is how many points. Radius is how far those points spread. They are different controls. Changing either one changes which searcher locations you sample.
Is this the same as choosing grid size?
No. Choosing size and radius is how to match customer geography before you start a trend.
That job is grid size and radius for local rank tracking. This page is what to do after someone already changed them. How to run the grid at all is how to track Google Maps rankings.
Old
What were grid size, radius and centre? Store the recipe with the old scans.New
What did you change, and on which date? A wider radius samples different demand.Split
Stop treating it as one trend Outer cells and averages will move even if Maps did not.Yes
Start a new labelled series Keep the old scans as a closed chapter.Next
Choosing size and radius is a different job How to pick settings sits on the grid-size guide.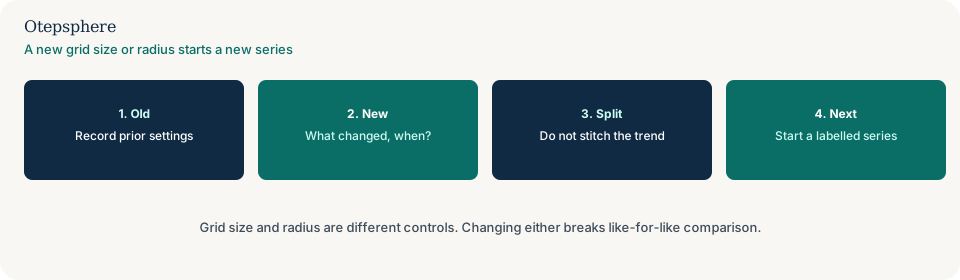
Is this the same as tracking over time?
No. Tracking over time assumes the recipe stayed still so a movement might be real.
Use how to track Local SEO rankings over time when settings were stable. If they were not, stop the old chart first.
Why do averages move when Maps did not?
A wider radius adds cells farther from the pin, where distance already makes you less relevant. The mean falls even if the inner cells did not.
A denser grid can add mid-block points that were never in the old average. Google’s local ranking help still includes distance. Source: Tips to improve your local ranking on Google.
How should you store the old and new scans?
Close the old series with its recipe. Start a new labelled series. Do not stitch the averages.
Keep the old exports. You may still compare inner cells if those coordinates still exist, but treat that as a subset, not the old KPI.
Settings-change decision table
| What you see | What it usually means | Decision | What not to assume |
|---|---|---|---|
| Radius doubled; average rank worse | New outer cells | Start a new series; inspect inner cells separately | That Maps visibility crashed overnight |
| Grid size increased; mean moved | Different sample | Do not stitch the chart | That more points are automatically more accurate |
| Centre moved to a new suburb | Different market | Treat it as a new study | That the old town’s trend continues |
| Settings unchanged; ranks still moved | Possible real change | Use the over-time tracking guide | That this settings page still applies |
What should I not do?
Action checklist
- Write the old grid size, radius, centre, query and date.
- Write what changed and when. Label the next scan as a new series.
- If you need a trend, revert to the old recipe or accept a break.
- Compare only cells that still share coordinates, and label that subset.
- If settings never changed, switch to over-time tracking.
- If you still need to choose a sensible size, switch to the grid-size guide.
When professional help makes sense
Help is useful when a year of scans used three different radii and nobody labelled them. It cannot recover a like-for-like trend that was never stored, and it cannot promise that a new recipe will match last year’s mean. If keywords or rank rules drifted as well as the grid, see why monthly local ranking reports are impossible to compare.
Sources and further reading
- Google Business Profile Help: Tips to improve your local ranking on Google
- Google Business Profile Help: Manage your service areas
The geo-grid average jumped after a settings change?
Otepsphere can separate a broken measurement series from a real visibility change — without treating a wider radius as a ranking crash.
Contact OtepsphereWho writes this
This page is published by Otepsphere, a specialist Local SEO consultancy. A named founder biography, photograph and professional profiles will be added here only when they have been verified. Until then, treat Otepsphere as the responsible organisation rather than a fictional expert.