What does a hidden decline mean?
It means branded queries — people already looking for your name — grew enough to hide a fall in service and town queries in the totals you usually quote.
Brand demand is useful. It is not the same job as winning “plumber near me” or the service you sell. Search Console can filter queries. Source: Search Console performance report: filter and compare.
Is this ranking for the business name only?
No. That guide is Maps or Search showing the brand and not the service. This page is website traffic mix.
Diagnose brand-only visibility on why you rank for the business name but not for services. Both can be true at once.
Split
Separate brand-name queries from service queries Search Console filters are the usual evidence.Total
Is sessions or clicks still rising? A rising total is not proof that Local SEO demand grew.Non
Did non-branded local queries fall? That is the series that can hide inside the total.Yes
Report both. Do not celebrate the sum alone Ranking for the business name is a different diagnosis.Next
A real ranking or lead drop is another playbook Confirm the mix before you treat it as a crash.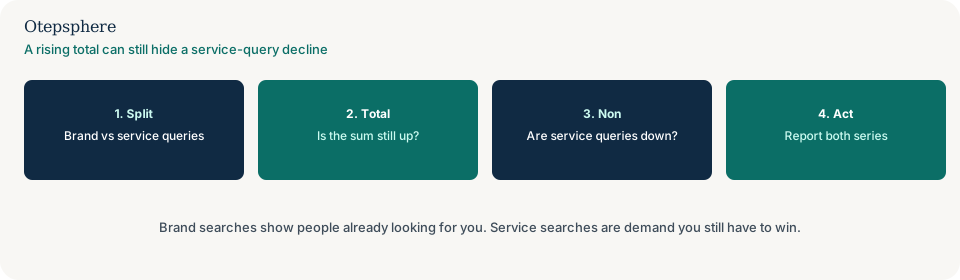
Is this a ranking and leads drop?
Not until you have split the series. A rising total is not a crash, and a falling non-branded set is not yet a full Local SEO failure.
If Maps visibility and qualified leads both fell after you confirm the mix, use why local rankings and leads dropped.
How do you split the series?
In Search Console, one filter for queries containing the brand (and obvious misspellings), and the complementary view for everything else. Repeat in GA4 if you have content groups or a brand landing-page segment.
Keep the same date range and country. Do not treat a branded homepage URL as non-branded demand.
What should you do with the mix?
Report both lines. Celebrate brand growth as brand growth. Treat a non-branded fall as a relevance and visibility job, not as proof the whole channel died.
Geographic Maps visibility is still a separate pattern: how to measure Google Maps visibility.
Mix decision table
| What Search Console shows | What it usually means | Decision | What not to assume |
|---|---|---|---|
| Total clicks up; branded up; non-branded down | Hidden decline | Report both series; investigate service queries | That Local SEO “is working” because the total rose |
| Brand queries dominate; Maps pack is name-only | Two related problems | Use this page and the brand-only ranking guide | That website mix and Maps pack are the same metric |
| Both branded and non-branded down | Broader drop | Use the rankings-and-leads-dropped guide | That brand growth is hiding anything |
| Non-branded up; branded flat | Healthy mix for acquisition | Keep splitting so you notice a later hide | That you can stop filtering |
What should I not do?
Action checklist
- Export Search Console queries for a closed period. Tag brand versus the rest.
- Chart both. Note whether the total hid a non-branded fall.
- If Maps is name-only, add the brand-ranking guide.
- If both series fell with leads, switch to the drop playbook.
- Keep the split in the monthly report so it cannot hide again.
- Do not treat the mix as a ranking factor Google documents.
When professional help makes sense
Help is useful when GA4, ads and Search Console each mix brand differently. It cannot promise that splitting the report will restore non-branded queries, and it cannot invent a Google “brand ratio” target.
Sources and further reading
Totals still hiding a non-branded local decline?
Otepsphere can split branded and service queries so a rising total cannot hide the demand you still have to win — without a ranking timetable.
Contact OtepspherePublished by Otepsphere
Published by Otepsphere, founded by Joseph Enmanuel. Learn about Otepsphere and its approach to local SEO.